
Appearance
The Overview dashboard
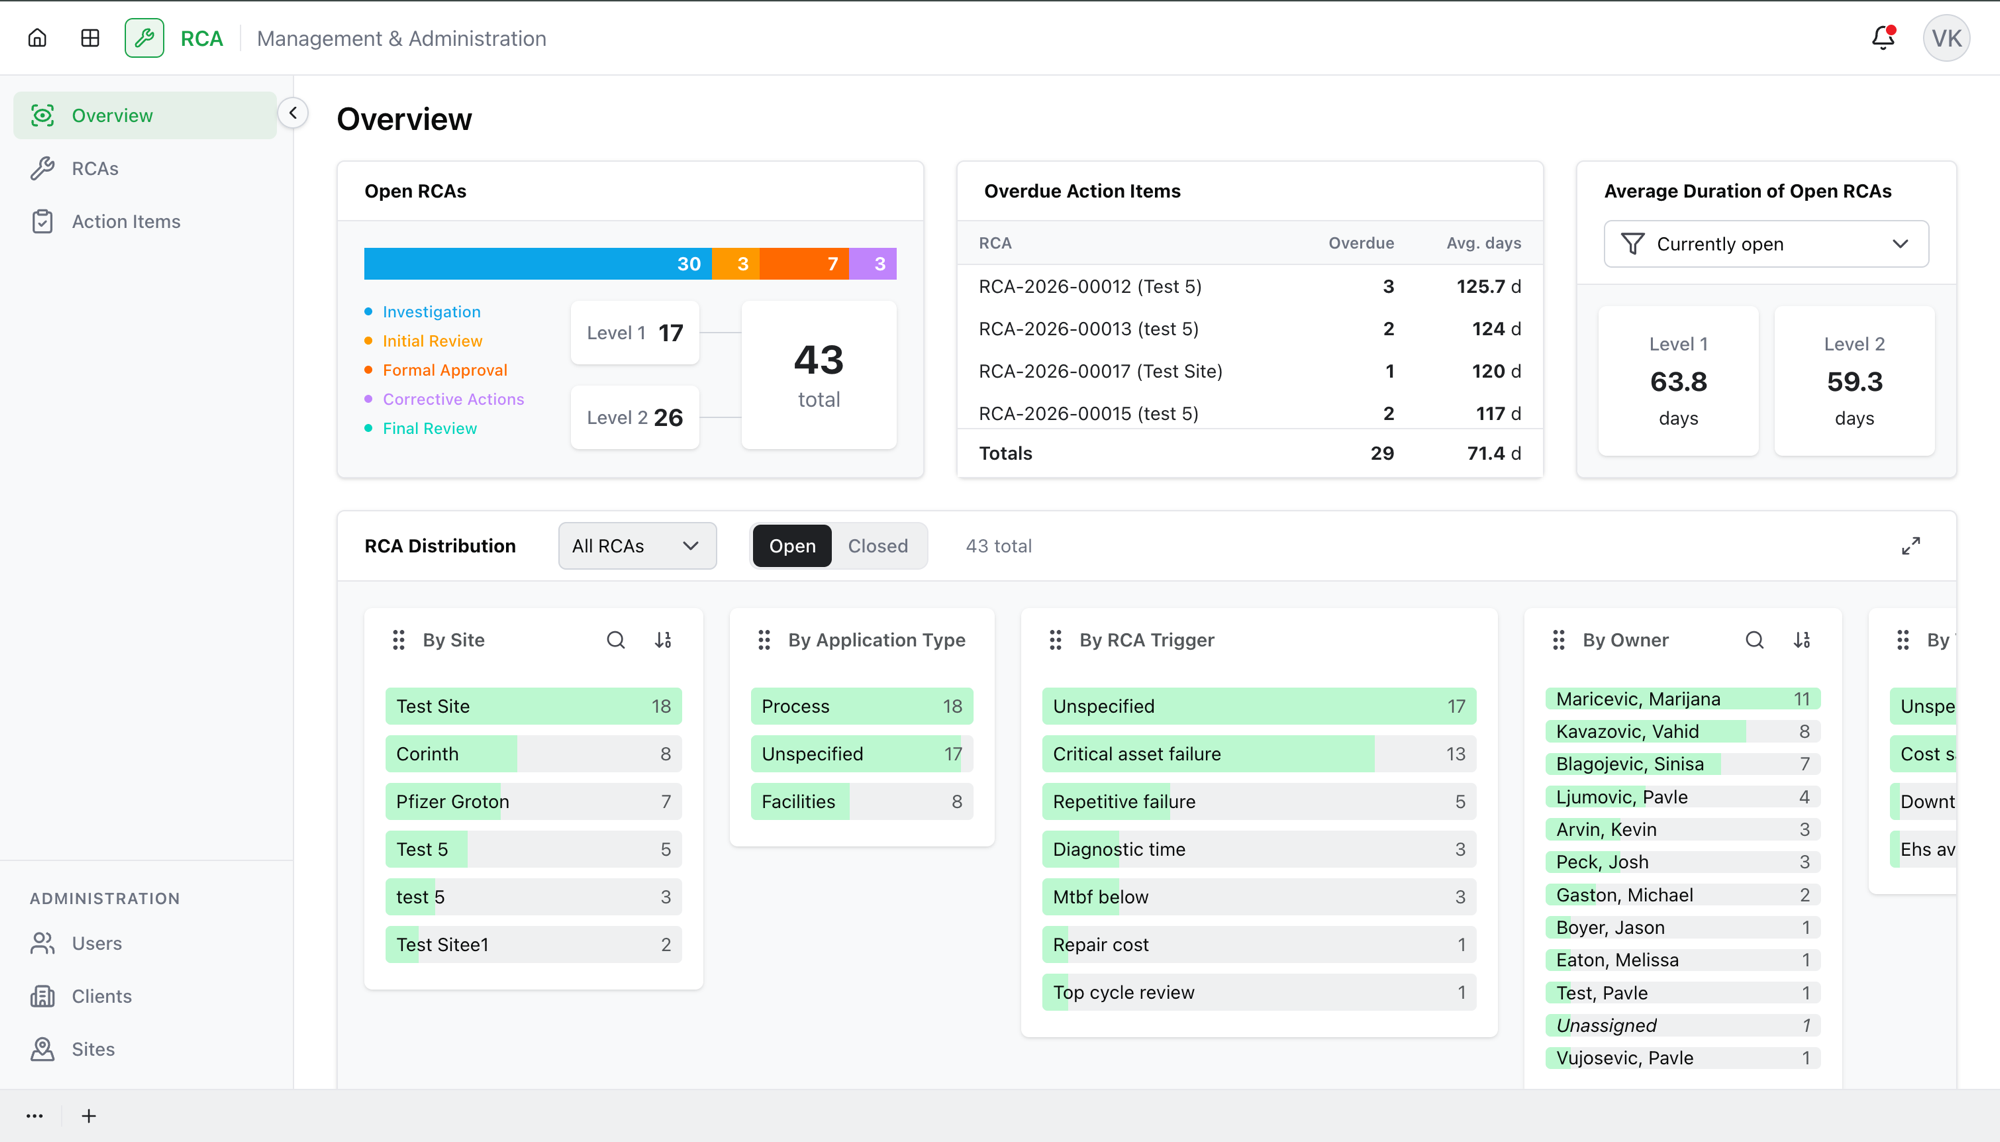
The Overview is the landing page when you sign in to the RCA app. It gives you an at-a- glance picture of your RCAs: how many are open, which action items are overdue, how long RCAs are taking, and how they break down across sites, owners, and other attributes.
The summary cards
Three cards across the top give you the key numbers.
Open RCAs
The total number of RCAs currently open, so you can see your active workload at a glance.
Overdue Action Items
The action items that are past their due date, grouped by RCA. For each RCA it shows how many items are Overdue and the average days overdue, with a Totals row at the bottom. If nothing is overdue, the card says so.
Average Duration of Open RCAs
How long RCAs are taking on average. A scope switch lets you choose:
- Currently open — the average age of RCAs open right now.
- All time — the average across all RCAs.
RCA Distribution
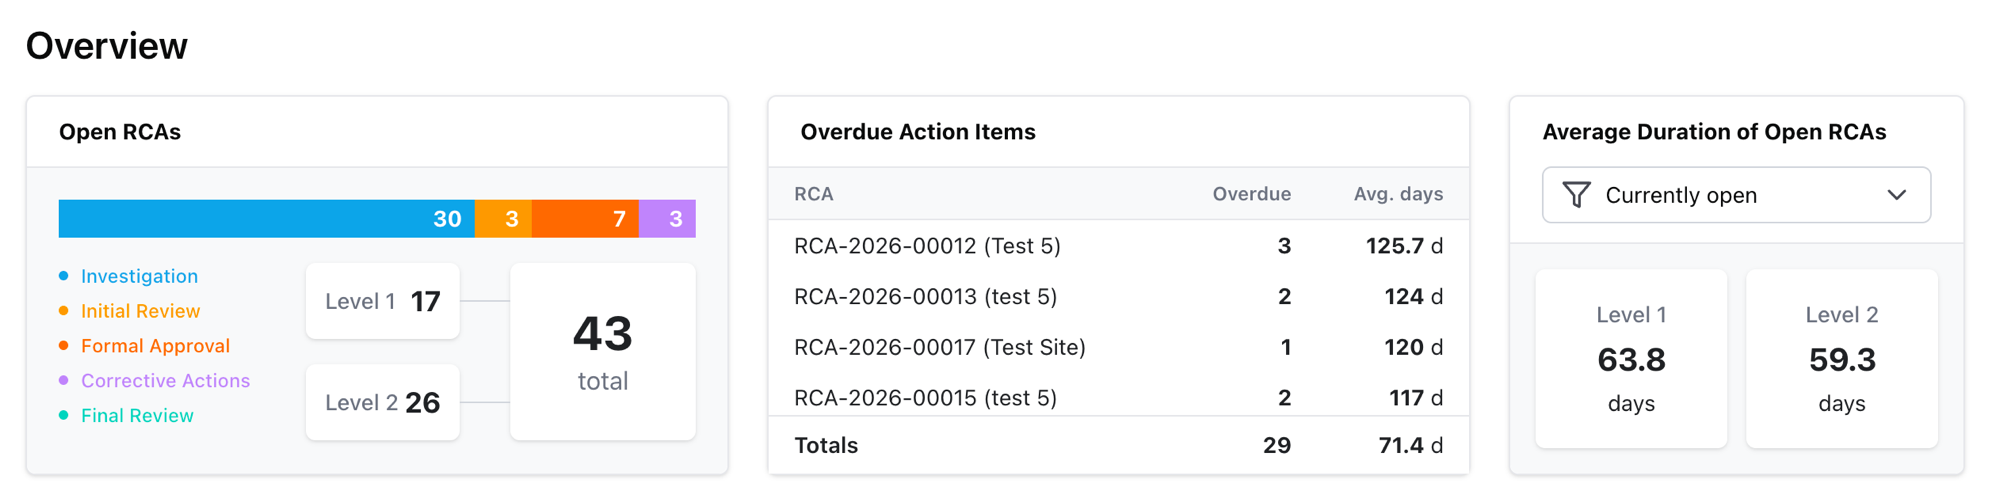
The RCA Distribution card breaks your RCAs down by an attribute so you can see where they cluster. You control three things:
| Control | Options |
|---|---|
| Scope | All RCAs, Open, or Closed. |
| Time period | All time, Last 30 days, Last 90 days, or Last year. |
| Group by | By Site, By Application Type, By RCA Trigger, By Owner, or By Value Type. |
Each row shows how many RCAs fall into that group. You can expand the card to see the full breakdown.
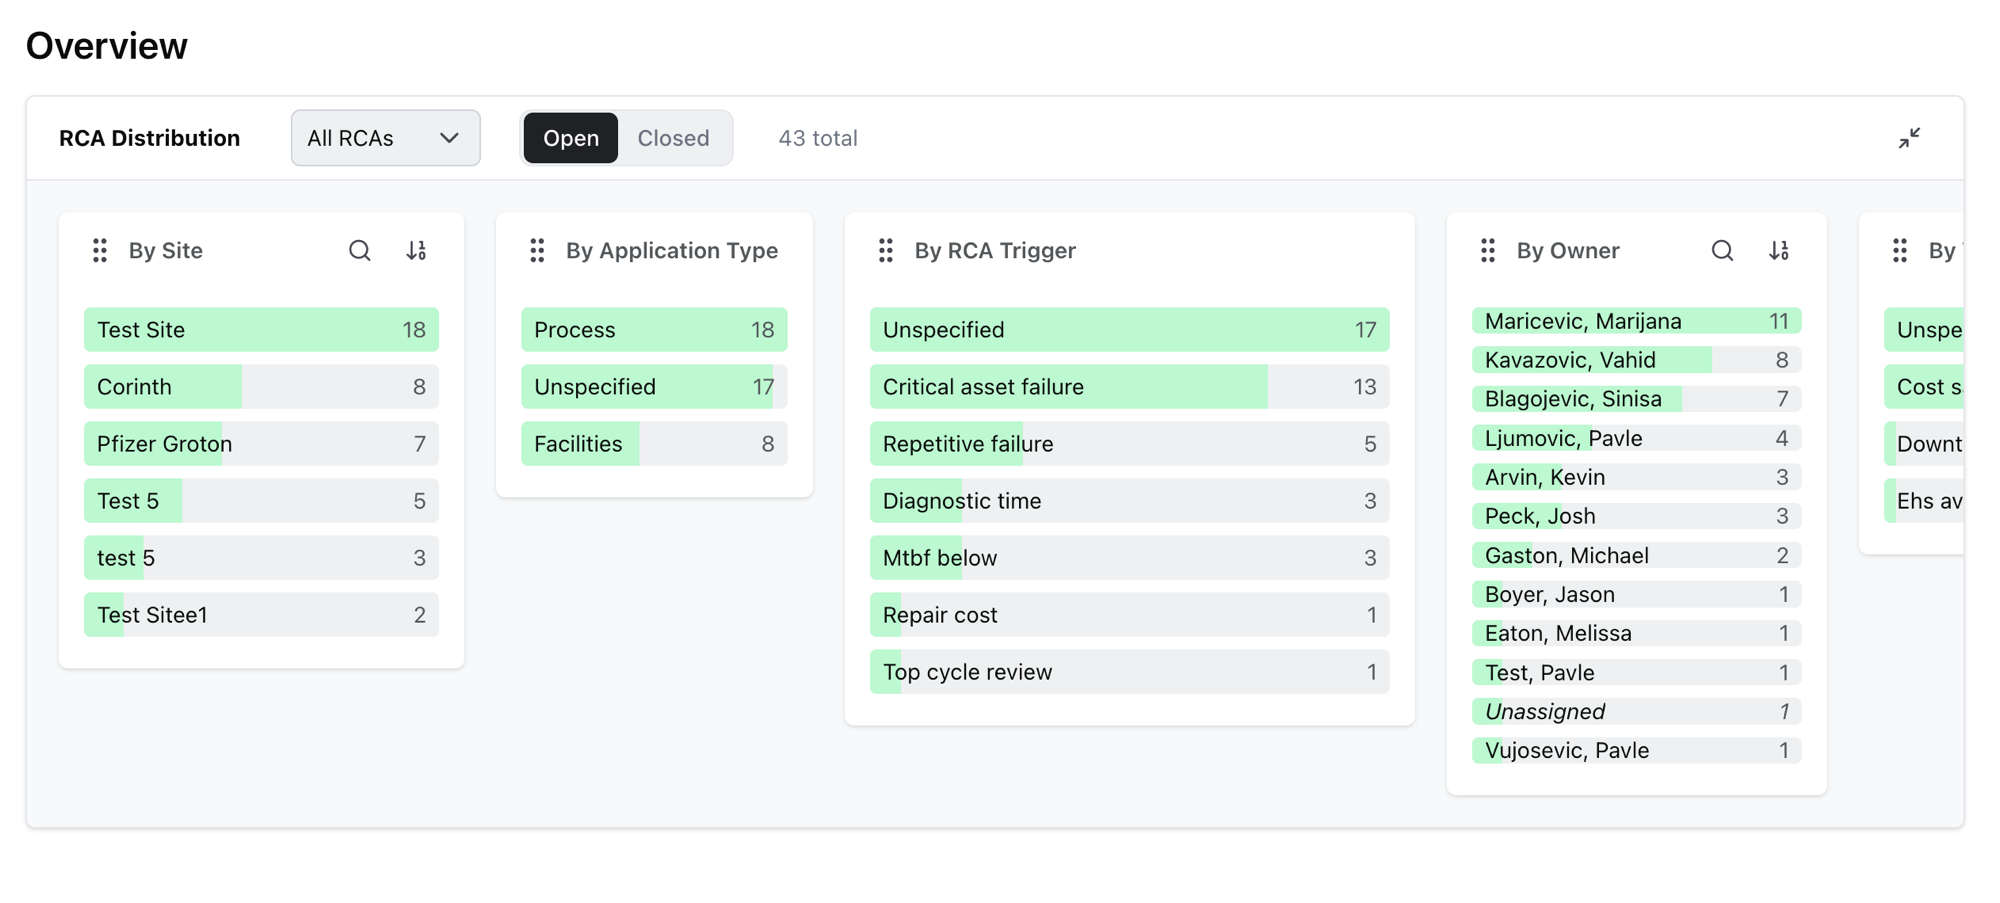
Each breakdown can be searched and sorted — for example, the By Site group lists each site with its RCA count.
Drilling down
Select a row in the distribution to drill down into it — the dashboard replaces the chart with the list of the RCAs behind that number, keeping the scope, level, and period you had applied. From there you can select an RCA to open its investigation, just like on the RCA list. Use Back to return to the distribution.
What's next
- Browse the full RCA list with its own filters.
- Browse action items, including overdue ones.
Troubleshooting
| Problem | What to do |
|---|---|
| A card shows "Failed to load dashboard data" | The data couldn't be fetched. Refresh the page; if it persists, check your connection. |
| The distribution looks empty | Widen the Scope (try All RCAs) and the Time period (try All time) — a narrow period or scope may have no matching RCAs. |
| The numbers don't match the RCA list | The dashboard reflects the scope, period, and grouping you've selected. Clear them, or drill down to see exactly which RCAs are counted. |
| You drilled down and want the chart back | Select Back to return from the drill-down list to the distribution. |